아날로그 신호는 사람이 보기에는 하나의 신호로 보이지만 잡음(노이즈) 등 여러 신호들이 섞여있는 형태다.
이런 신호를 주파수 영역에서 보면 각각 주파수 성분을 가지는 신호로 분해가 가능하다.
[시간-진폭 => 주파수-진폭 변환]
[python-FFT]
1. x, y 신호 임의 생성
- x는 20Hz를 가지며, y는 50Hz의 신호를 가짐
- Sampling rate : 2000Hz
#-*- coding:utf-8 -*-
import matplotlib.pyplot as plt
import numpy as np
import math
%matplotlib inline

Fs = 2000.
Ts = 1 / Fs
te = 1
t = np.arange(0, te, Ts)

# Signal
x = np.cos(2*np.pi*20*t)
y = np.cos(2*np.pi*50*t)

plt.rcParams["figure.figsize"] = (15,4)
plt.rcParams['axes.grid'] = True

plt.plot(t, x, 'r')
plt.title('20Hz')
plt.xlabel('time/s')
plt.ylabel('y')
plt.show()

plt.plot(t, y, 'y')
plt.title('50Hz')
plt.xlabel('time/s')
plt.ylabel('y')
plt.show()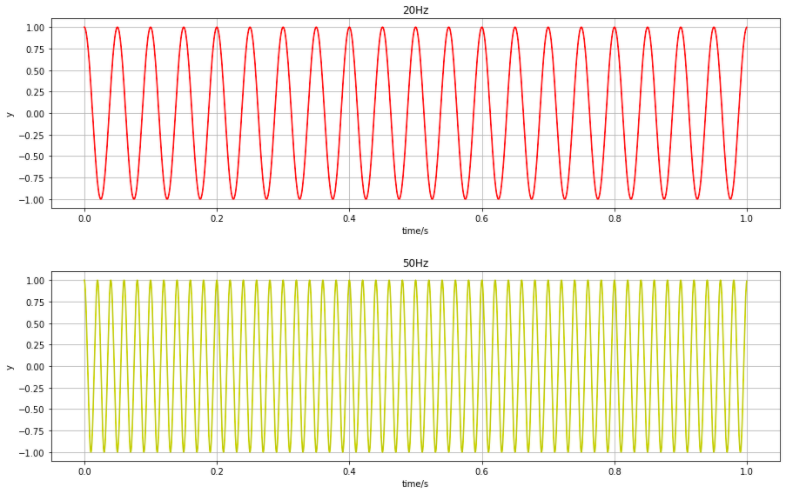
2. x, y 각각 FFT 적용
- 적용 시, 다음과 같이 출력됨
# x 신호 FFT
Nx = len(x)
print("len x data : ", Nx)
kx = np.arange(Nx)
Tx = Nx / Fs
freqx = kx / Tx
freqx = freqx[range(int(Nx/2))]
yfx = np.fft.fft(x) / Nx
yfx = yfx[range(int(Nx/2))]
plt.plot(freqx, abs(yfx), 'g')
plt.xlim(0, Fs / 20)
# plt.ylim(-5, 10)
plt.show()
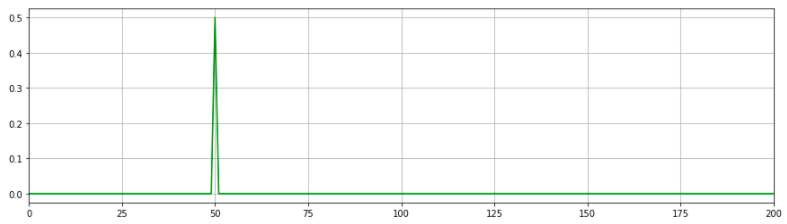
# y 신호 FFT
Ny = len(y)
print("len y data : ", Ny)
ky = np.arange(Ny)
Ty = Ny / Fs
freqy = ky / Ty
freqy = freqy[range(int(Ny/2))]
yfy = np.fft.fft(y) / Ny
yfy = yfy[range(int(Ny/2))]
plt.plot(freqy, abs(yfy), 'g')
plt.xlim(0, Fs / 10)
# plt.ylim(-5, 10)
plt.show()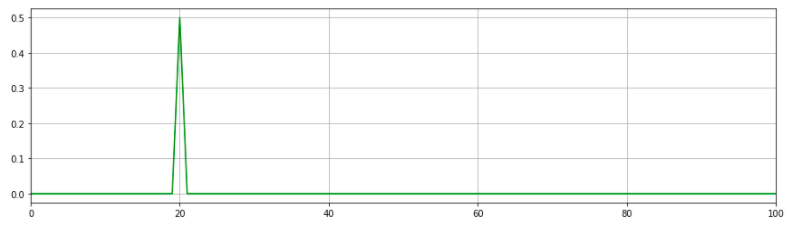
3. x, y 신호 합성
z = x + y
plt.plot(t, z, 'r')
plt.title('20 + 50(Hz)')
plt.xlabel('time/s')
plt.ylabel('y')
plt.show()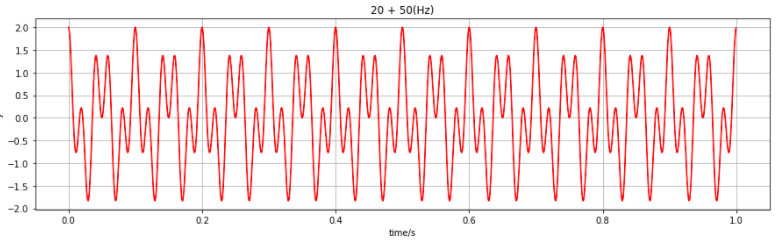
4. 합성 신호(x, y) FFT
N = len(z)
print("len z data : ", N)

k = np.arange(N)
T = N / Fs
freq = k / T
freq = freq[range(int(N/2))]

yfft = np.fft.fft(z)
yf = yfft / N
yf = yf[range(int(N/2))]

plt.plot(freq, abs(yf), 'b')
plt.xlim(0, Fs / 20)
# plt.ylim(-5, 10)
plt.show()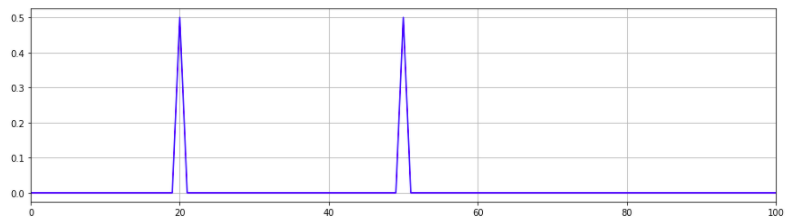
=> 다음과 같은 신호에서 band pass filter, low pass filter 등을 적용해 신호를 제거(=노이즈 제거) 또한 할 수 있음
'Domain > Audio' 카테고리의 다른 글
| # Band pass Filter + Low pass Filter + High pass Filter_python (3) | 2020.09.17 |
|---|---|
| # Spectrogram_python (0) | 2020.09.16 |